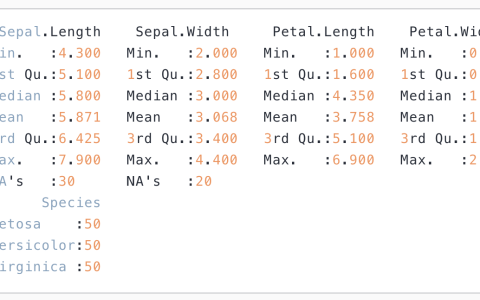
以R内置的pbc数据集为例,看看如何用R语言的jstable包来实现Cox回归亚组分析和交互作用效应。pbc数据集是survival包中的一个数据集,包含原发性胆汁性肝硬化(Primary Biliary Cirrhosis,PBC)患者的生存数据。变量如下图所示:

1、使用library命令加载包并查看数据
library(jstable)   #加载jstable包,用于亚组分析
library(survival)  #加载survival包,调用pbc数据集
library(forestploter)  #加载forestploter包,用于绘制森林图
library(grid)  #加载grid包,用于基础绘图
str(pbc)  #查看数据集
2、选择变量并将其转换为因子变量
library(tidyverse)  #加载tidyverse包,用于处理数据
df <- pbc %>%
select(time, status, sex, age, ascites, hepato, edema, spiders, stage, trt) %>%  #从pbc数据集中选择需要的变量
          mutate(status = as.integer(status == 2),
       age = ifelse(age > 40,"> 40", "<= 40"),
       age = factor(age, levels = c("> 40", "<= 40")),
       ascites = factor(ascites, levels = c(0, 1), labels = c("No", "Yes")),
       hepato = factor(hepato, levels = c(0, 1), labels = c("No", "Yes")),
       edema = factor(edema, levels = c(0, 1), labels = c("No", "Yes")),
       spiders = factor(spiders, levels = c(0, 1), labels = c("No", "Yes")),
       stage = factor(stage, levels = c(1, 2, 3, 4), labels = c("I", "II", "III", "IV")),
       trt = factor(trt, levels = c(1, 2), labels = c("D-penicillamine", "Placebo"))
  )  #将分类变量转化为因子变量
str(df)
#status是不需要变成因子变量的
3、进行亚组分析和交互作用效应
res <- TableSubgroupMultiCox(formula = Surv(time, status) ~ sex,
                         var_subgroups = c("age", "ascites", "hepato", "edema", "spiders",
                                           "stage", "trt"),
                          data = df
)
res

4、绘制森林图
plot_df <- res  #对res数据重新命名
plot_df[, c(2, 3, 9, 10)][is.na(plot_df[, c(2, 3, 9, 10)])] <- " "  #选取第2、3、9、10列的数据在森林图中显示,并替换缺失值NA为一个空格字符
plot_df$` ` <- paste(rep(" ", nrow(plot_df)), collapse = " ")  #添加空白列,用于存放森林图的图形部分
plot_df[, 4:6] <- apply(plot_df[, 4:6], 2, as.numeric)  #将第4到第6列的数据转换为数值型
plot_df$"HR (95% CI)" <- ifelse(is.na(plot_df$"Point Estimate"), "",
                                 sprintf("%.2f (%.2f to %.2f)",
                             plot_df$"Point Estimate", plot_df$Lower, plot_df$Upper))  #计算HR (95% CI),以便显示在图形中
plot_df  #查看数据
# 绘制森林图
p <- forest(
  data = plot_df[, c(1, 2, 3, 11, 12, 9, 10)],  # 选择需要用于绘图的列
  lower = plot_df$Lower,  # 置信区间下限
  upper = plot_df$Upper,  # 置信区间上限
  est = plot_df$`Point Estimate`,  # 点估计值
  ci_column = 4,  # 点估计对应的列
  ref_line = 1,   # 设置参考线位置
  xlim = c(0, 5)  # x轴的范围
)

# 打开 PNG 图形设备,设置宽度和高度
png("forest_plot.png", width = 3200, height = 2000, res = 300)

# 绘制森林图
plot(p)

dev.off()
特别申明:本文为转载文章,转载自鸿创医学,不代表贪吃的夜猫子立场,如若转载,请注明出处:https://zhuanlan.zhihu.com/p/14801417309
 微信扫一扫
微信扫一扫  支付宝扫一扫